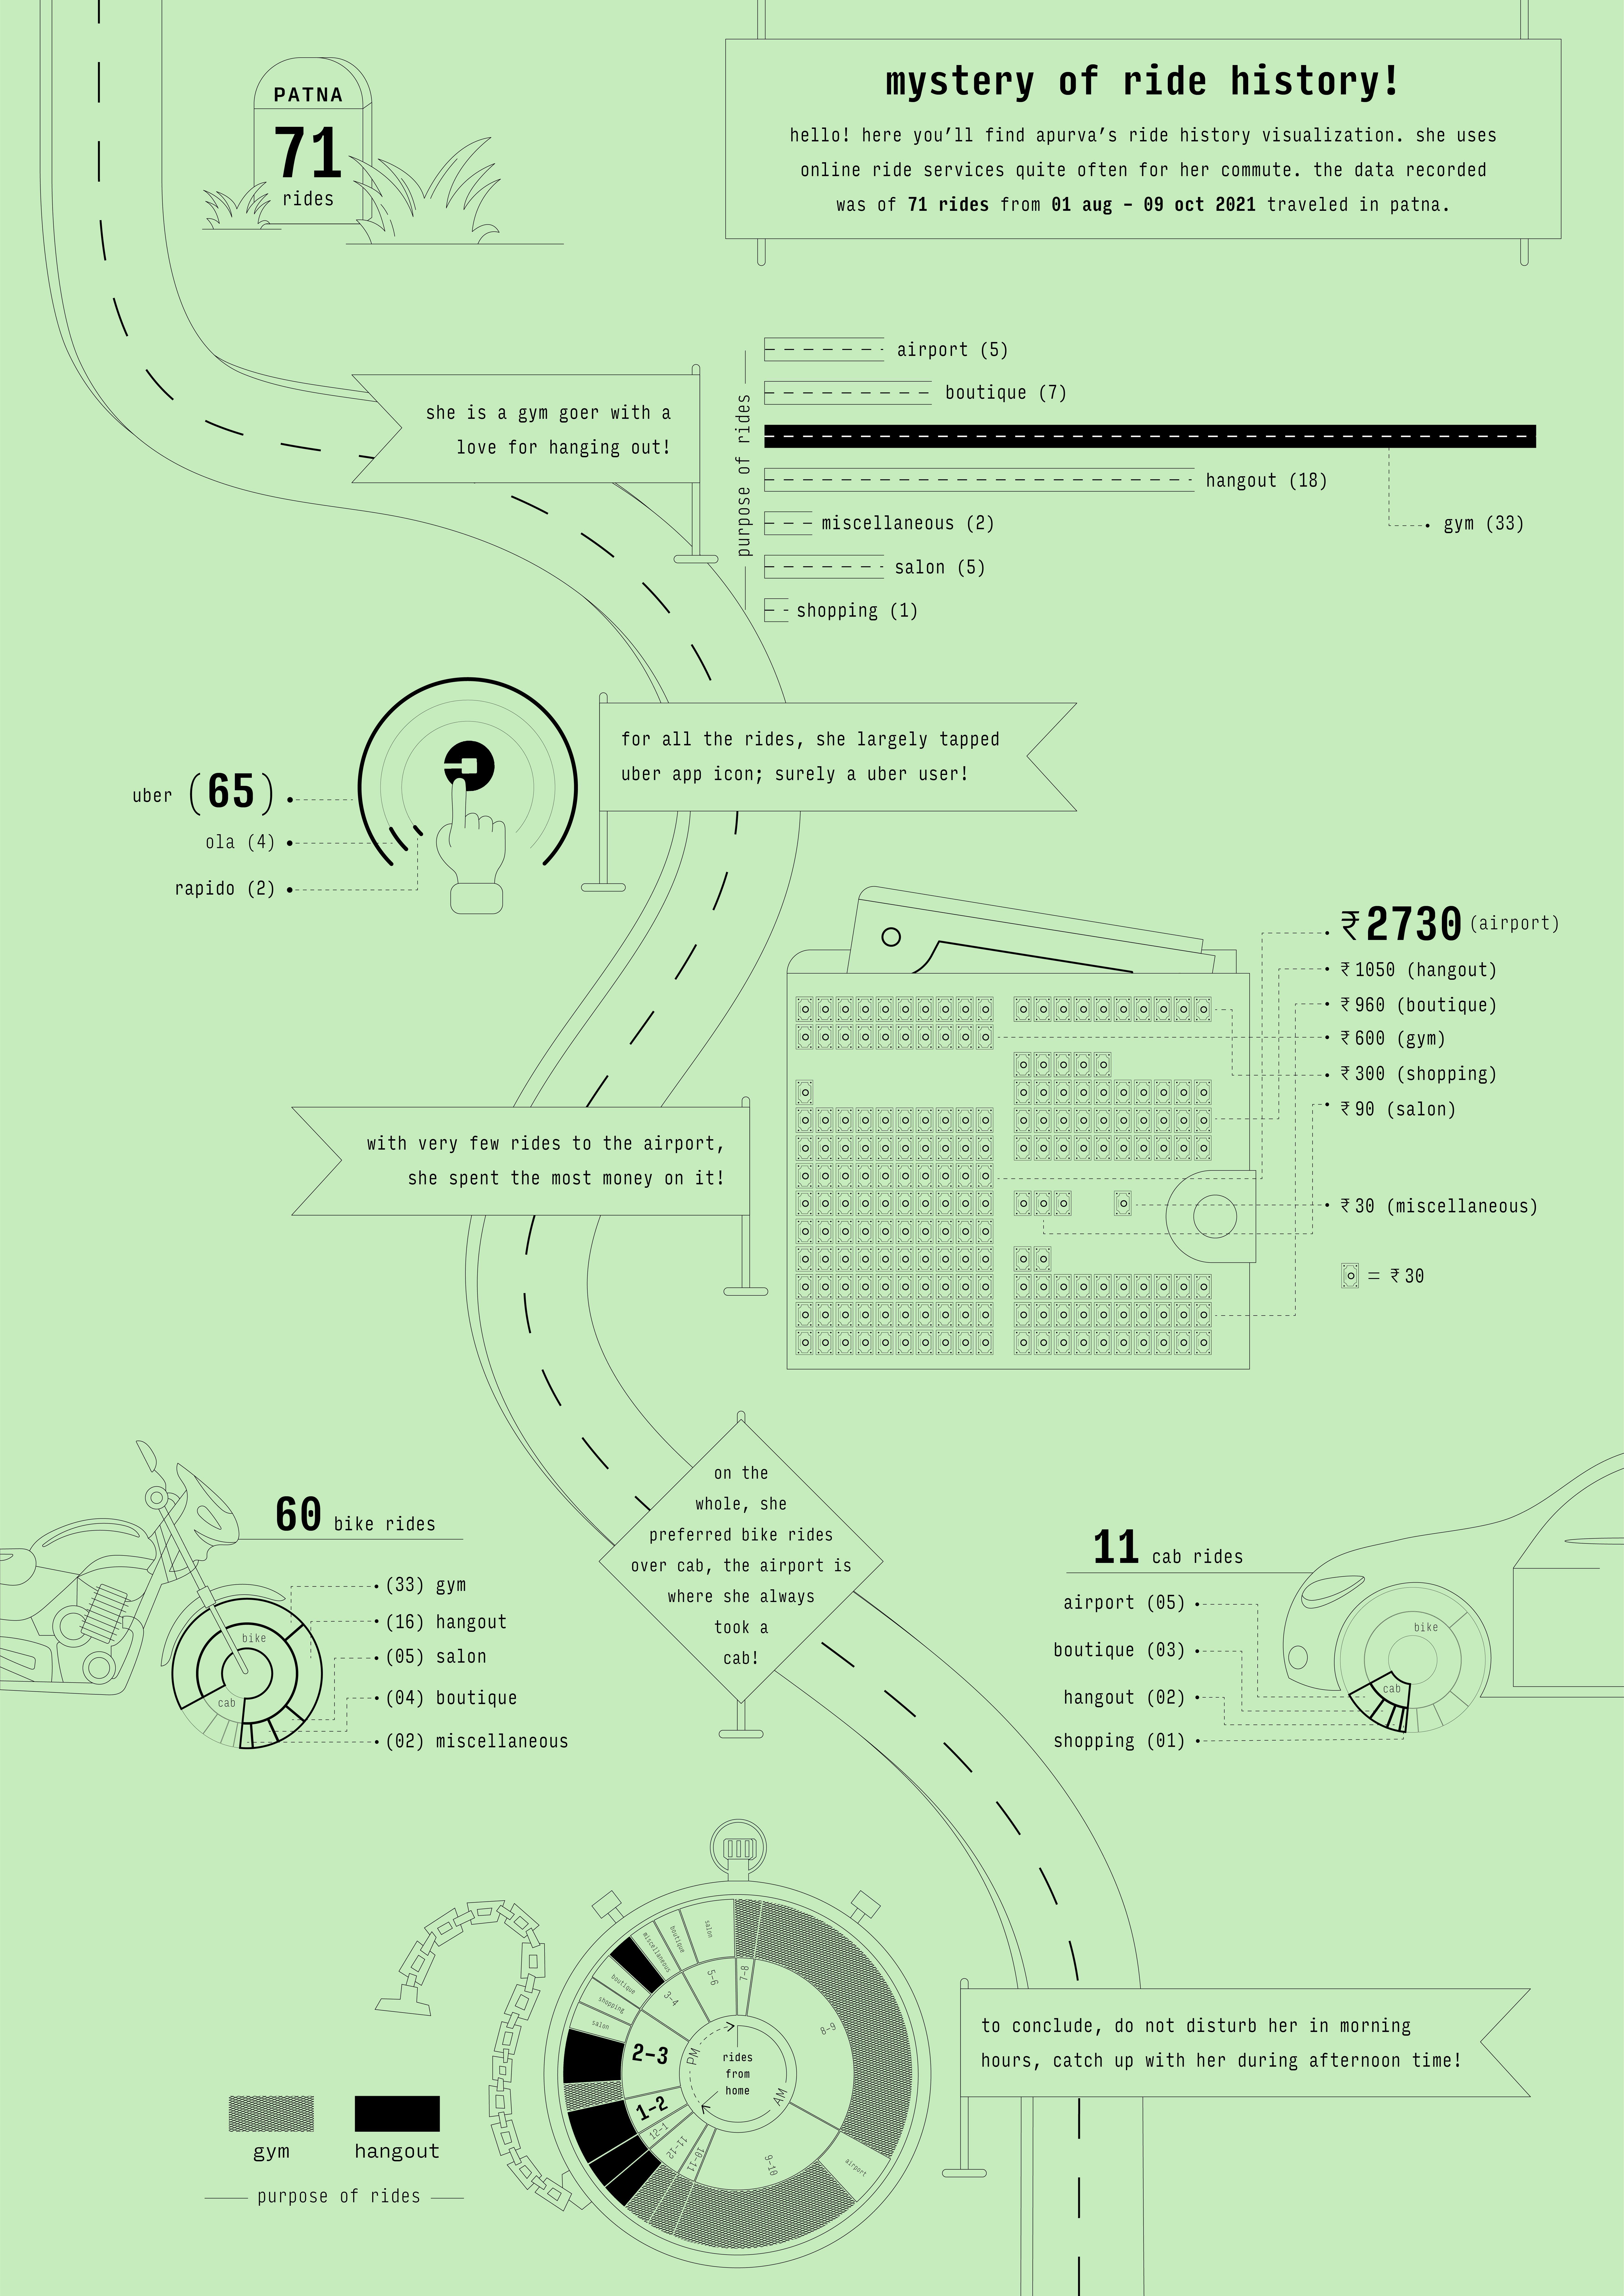
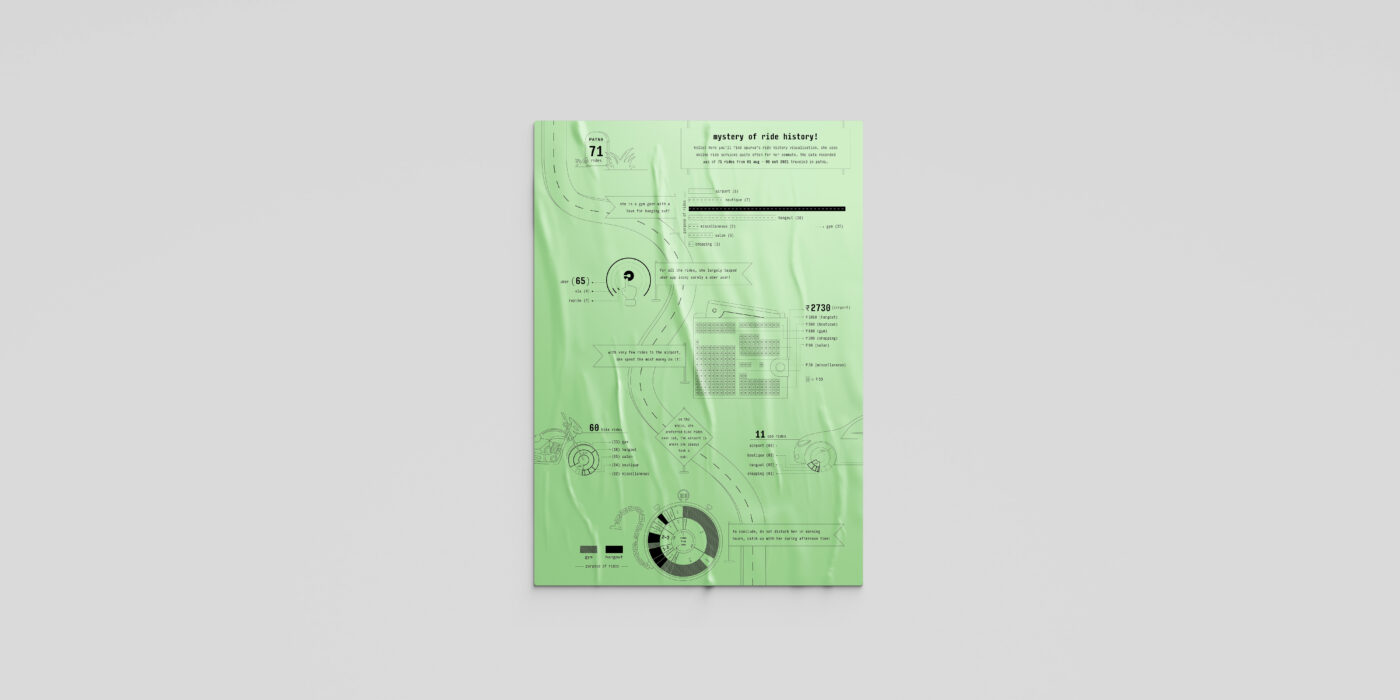
A data visualization of the history of 71 online ride services from 01 Aug – 09 Oct 2021 traveled in Patna.
PROJECT
NID Classroom Project
Course: Design Workshop – lll (Visualizing Information)
Guide: Rasagy Sharma
TIMELINE
1 week
Jan 2022
Process

Raw Data
What does your phone know about you?
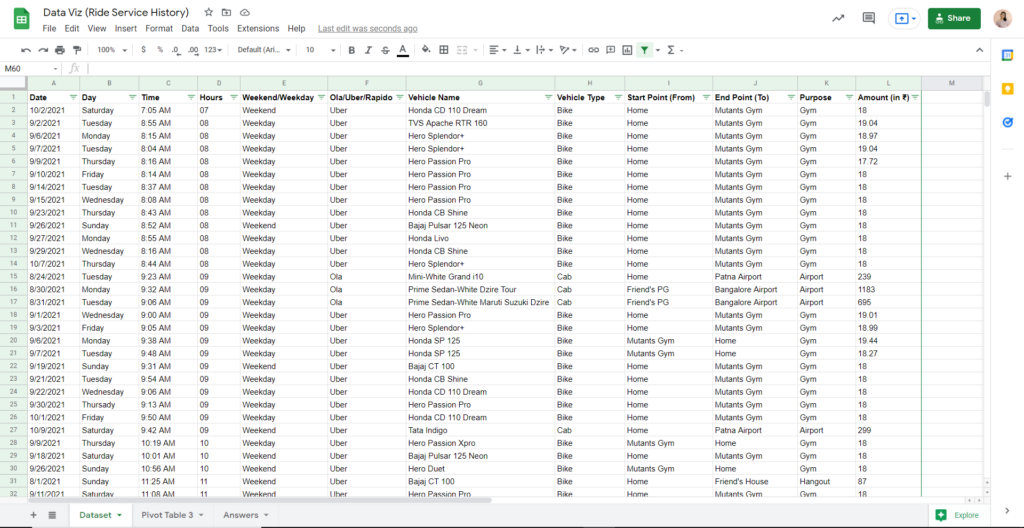
Data was collected from 01 Aug – 09 Oct 2021 from all the ride services (ola, uber, rapido) used. The data comprised of time, date, day of ride, vehicle type, start point, end point, purpose of ride, and money spent.
Exploratory Analysis of Data
What questions can this data answer about me that someone else might care about?
The data was examined, with an effort to discern its interesting aspects and potential insights that may be of interest to others.

Explanatory Analysis of Data
Where do you want your audience to pay attention?
Pre-attentive attributes were used to emphasize the data findings with particular attention given to the deliberate use of stroke width.
How do you make data a pivotal point in an overarching story?
An overarching story was made to weave all the disparate pieces of insights together and the selection of charts was contingent upon the story intended to be conveyed.
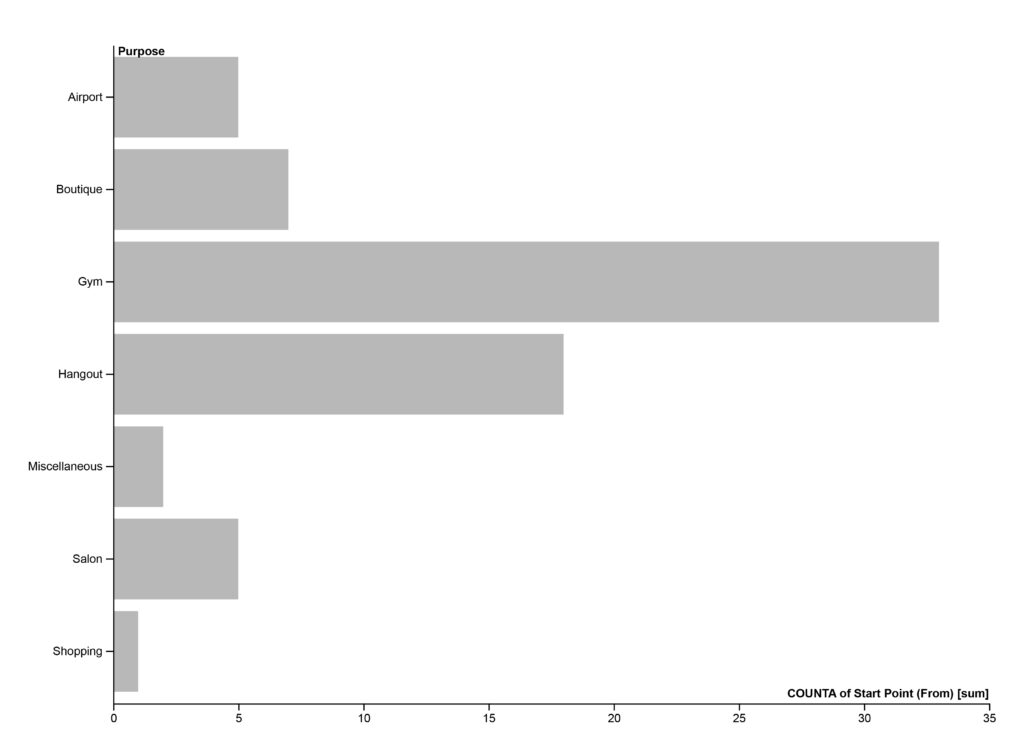
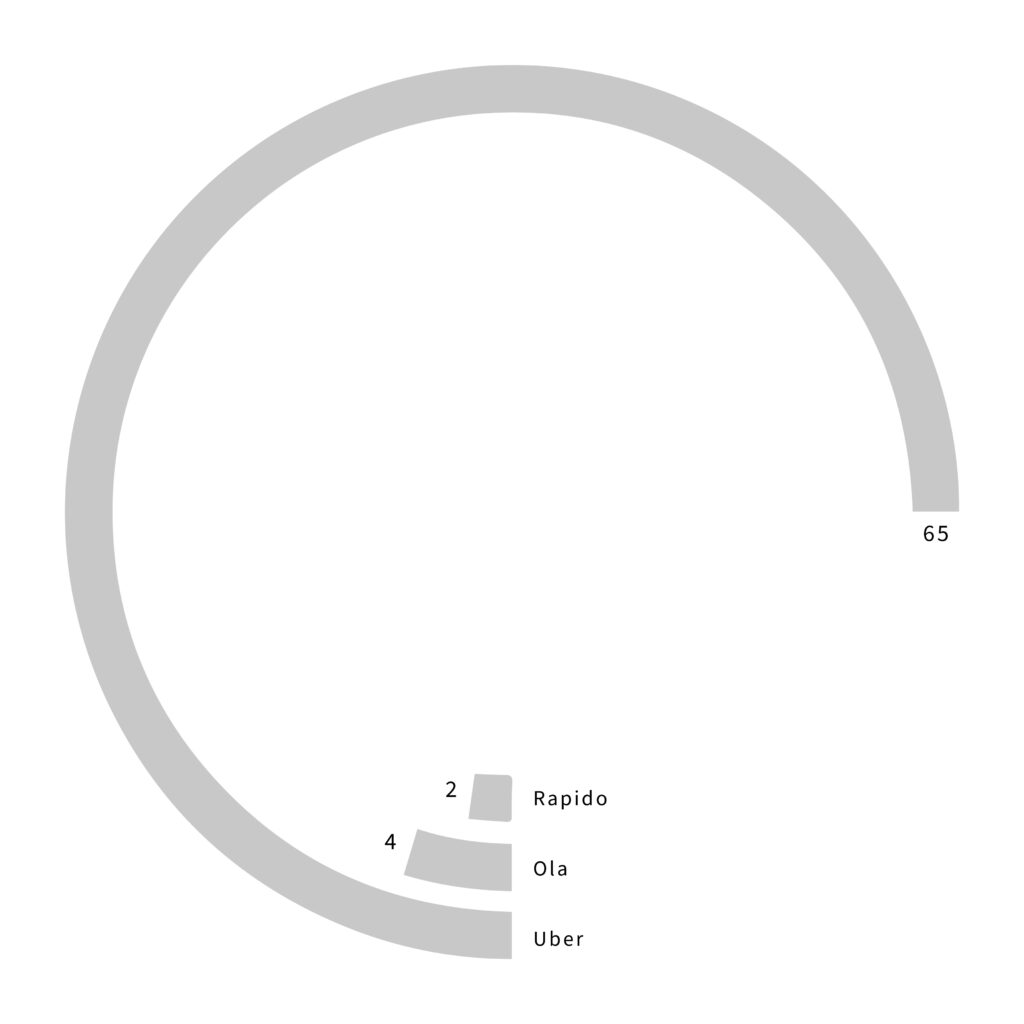
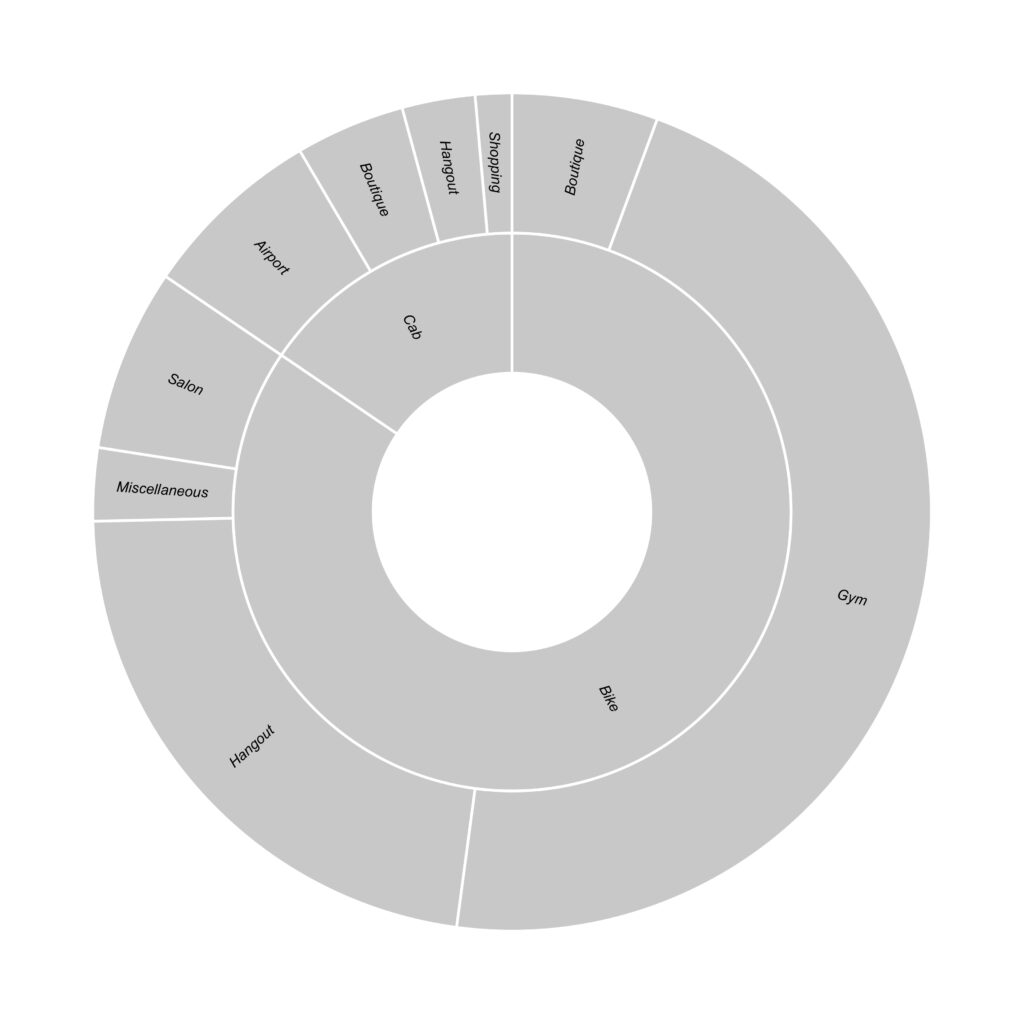
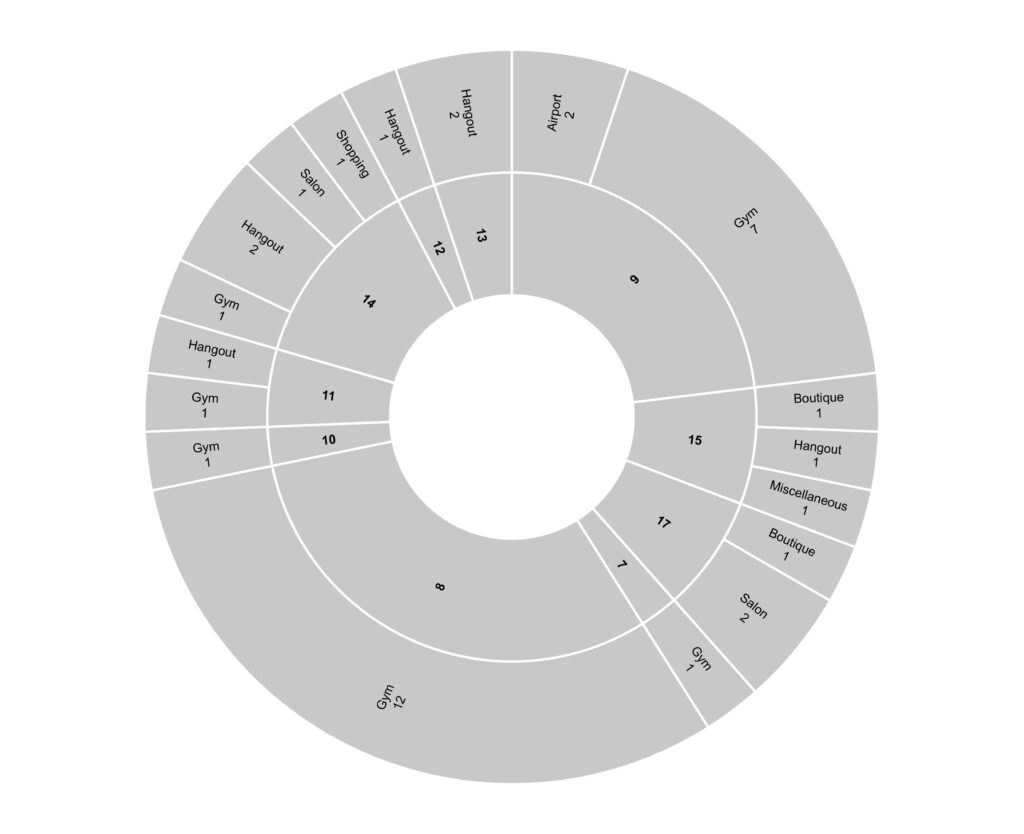
and here’s the final data visualization
